Classification metrics
When evaluating classification models, different metrics are used compared to regression models. These metrics help to understand how well the model is performing, especially in terms of correctly predicting different classes. Let’s look at what they are:
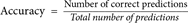
- Accuracy: This is the most intuitive performance measure, and it is simply a ratio of correctly predicted observations to the total observations. It’s suitable for binary and multiclass classification problems:
2. Precision (best for binary classification – with only two classes): Also known as positive predictive value, this metric helps to answer the question: “What proportion of positive identifications was actually correct?”

Here, TP is the number of true positives (predicted positive and the prediction was correct), and FP is the number of false positives (predicted positive but the prediction was incorrect).
3. Recall (Sensitivity) (best for binary classification – with only two classes): This metric helps to answer the question: “What proportion of actual positives was identified correctly?”
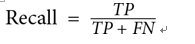
Here, TP (predicted positive and the prediction was correct) is the number of true positives, and FN is the number of false negatives (predicted negative but the prediction was incorrect).
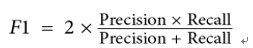
4. F1 Score: The F1 Score is the weighted average of precision and recall. Therefore, this score takes both false positives and false negatives into account. It is a good way to show that a classifier has a good value for both precision and recall:
These metrics are crucial for understanding the behavior of classification models, especially in domains where the costs of false positives and false negatives are very different.
So, we have way more ham messages than we do spam. Because this is a classification problem, it would be very useful to know our null accuracy rate, which is the percentage chance of predicting a single row correctly if we keep guessing the most common class, ham. Here’s how we do that:
df.label.value_counts() / df.shape[0]
ham0.865937
spam 0.134063
So, if we blindly guessed ham, we would be correct about 87% of the time, but we can do better than that.
If we have a set of classes, C, and features, , then we can use Bayes’ theorem to predict the probability that a single row belongs to class C, using the following formula:
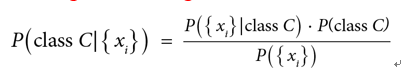
Let’s look at this formula in a little more detail:
