Exploring the Titanic dataset
The Titanic dataset is truly a classic in the field of data science, often used to illustrate the fundamentals of ML. It details the tragic sinking of the RMS Titanic, one of the most infamous shipwrecks in history. This dataset serves as a rich source of demographic and travel information about the passengers, which can be utilized to model and predict survival outcomes.
Through the lens of this dataset, we can apply statistical analysis and predictive modeling to understand factors that may have influenced the chances of survival. For instance, consider a subset of only 25 passengers from the Titanic dataset. Out of 25, 10 of these individuals survived the disaster, while 15 did not. By examining attributes such as age, gender, class, and fare paid, we can begin to construct a predictive model that estimates the likelihood of survival for each passenger in similar circumstances.
We first calculate the Gini index before doing anything.
In this example, overall classes are survived and died, illustrated in the following formula:

This Gini index of 0.48 indicates the level of impurity in the dataset. The value suggests a moderate separation between the classes, with some degree of mixture between the survived and died categories within this group of passengers.
If we were to make a split in the dataset based on a certain feature, we would calculate the Gini index for each resulting subset. The goal is to choose a split that minimizes the Gini index, thus increasing the purity of the subsets with respect to the target variable, which in this case is survival on the Titanic.
Now, let’s consider a potential split on gender. We first calculate the Gini index for each given gender, as seen in Figure 11.5:
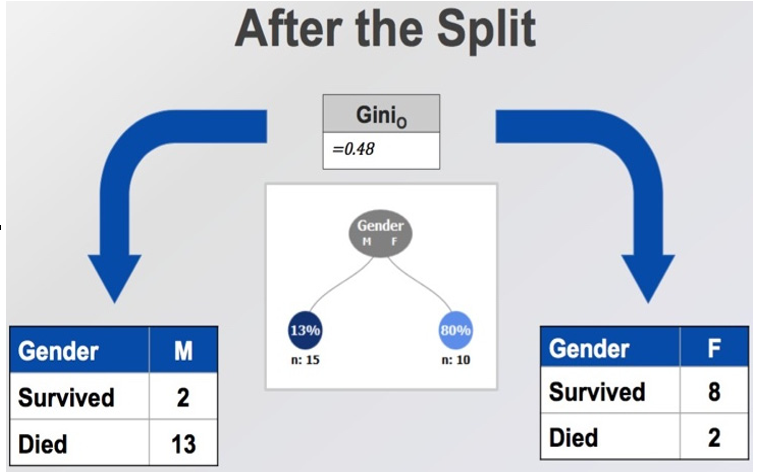
Figure 11.5 – Calculating impurity of our dataset on gender
The following formula calculates the Gini index for male and female, as follows:
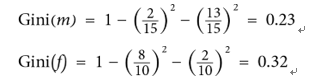
Once we have the Gini index for each gender, we then calculate the overall Gini index for the split on gender, as follows:

So, the Gini coefficient for splitting on gender is 0.27. We then follow this procedure for three potential splits (shown in Figure 11.6):
- Gender (male or female)
- Number of siblings on board (0 or 1+)
- Class (first and second versus third)
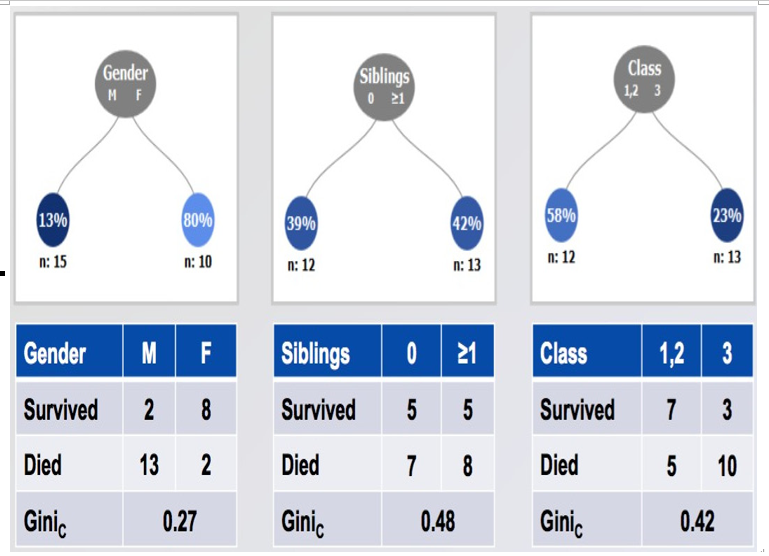
Figure 11.6 – Calculating the resulting Gini coefficient for multiple splits on our dataset to decide which one to use for our decision tree
In this example, we would choose the gender to split on as it has the lowest Gini index!Before we get to some more code, we need to think about how to deal with categorical features that are not numerically encoded. ML algorithms require numerical inputs, and most datasets will have at least one feature that is not numerical.